Circular Dichroism FAQs
What is chirality?
- Chiral molecules are mirror images or enantiomers. There is no symmetry operation in 3D-space that can be performed on one enantiomer to make it overlay the other. Enantiomerism is a special form of isomerism. The physical properties of enantiomers are identical in every way except two: how the molecules interact with polarised light and how they interact with other chiral molecules.
- For example, camphorsulfonic acid (CSA), which is regularly being used for calibration of CD instruments, exists as two enantiomers that are mirror images of each other:
To really understand what circular dichroism is, you must first understand the basics of polarisation.
- The polarisation of light describes the geometric orientation that transverse light waves are oscillating in.
- For a linearly polarised light wave, the oscillation of its electric vector is confined to a single plane.
- All states of polarised light can be described as a sum of two linearly polarised states at right angles (orthogonal) to each other, usually referenced to the viewer as vertically (left figure) and horizontally (right figure) polarised light:
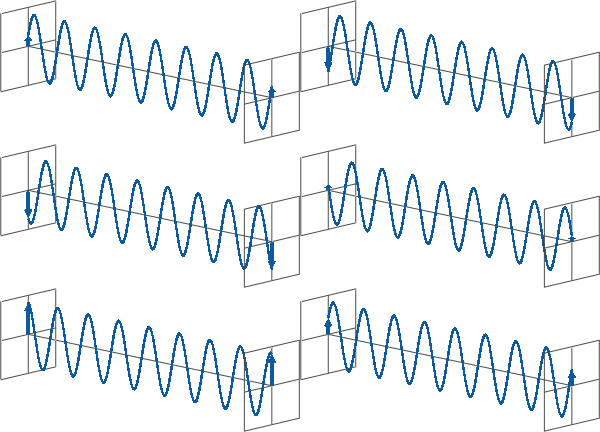
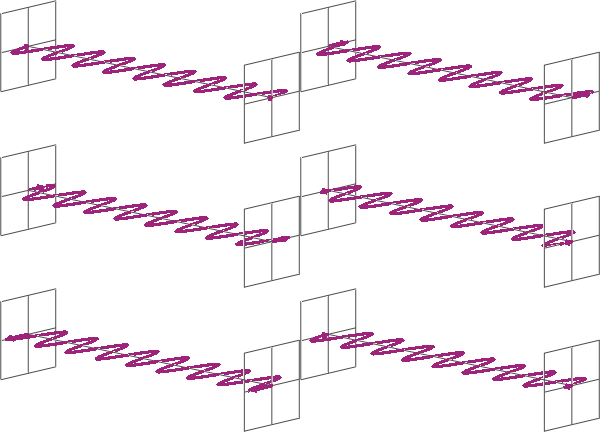
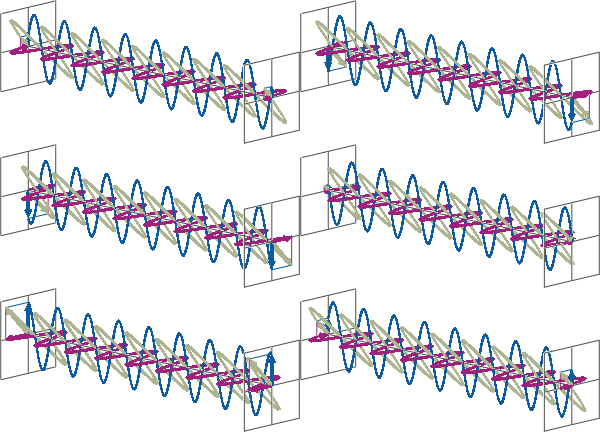
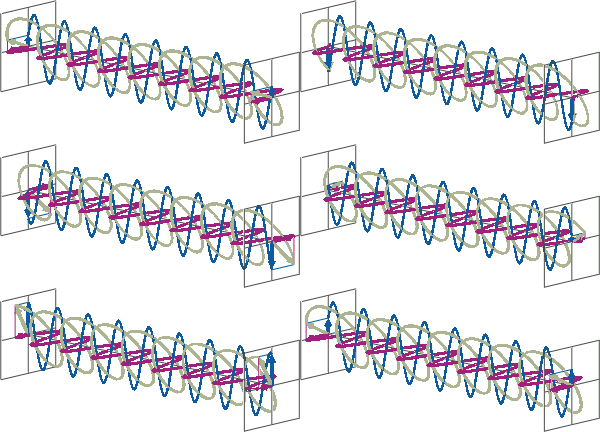
If, for instance, horizontally and vertically polarised light waves are combined that are of equal amplitude and in phase with each other, the resultant light wave (grey) is also linearly polarised but rotated at 45 degrees (left figure).
If the two polarisation states are out of phase, the resultant wave ceases to be linearly polarised. For example, at a phase difference an eighth of the wavelength, the resultant light wave is elliptically polarised (right figure).
How is CD spectroscopy different to other spectroscopic methods?
- CD spectroscopy is an absorbance-based technique very similar to UV/Vis spectroscopy. The major difference is that for CD spectroscopy, light of a different polarisation is being used. A CD spectrometer alternatingly generates left-handed circularly polarised (L-CP) light (left figure) and right-handed circularly polarised (R-CP) light (right figure) at a high frequency (typically 50 kHz).
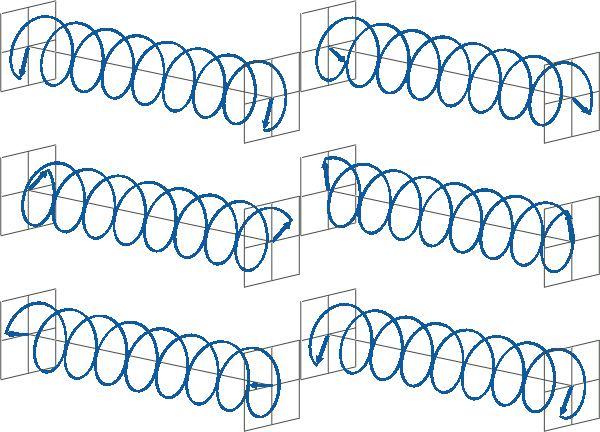
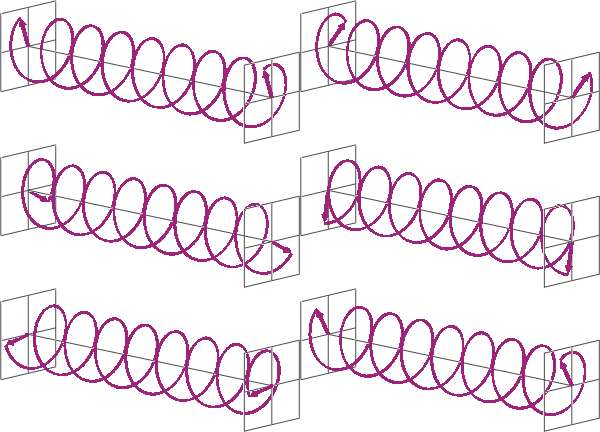
- If two linearly polarised light waves that are of equal amplitude and orthogonal to each other are out of phase by a quarter-wave, the resultant will be a helix and is known as circularly polarised (CP) light. The helices can be either right-handed (R-CP) or left-handed (L-CP), depending on whether the phase difference is -1/4 of the wavelength (left figure below) or +1/4 of the wavelength (right figure below), respectively. These two polarisation states are non-superimposable mirror images of each other.
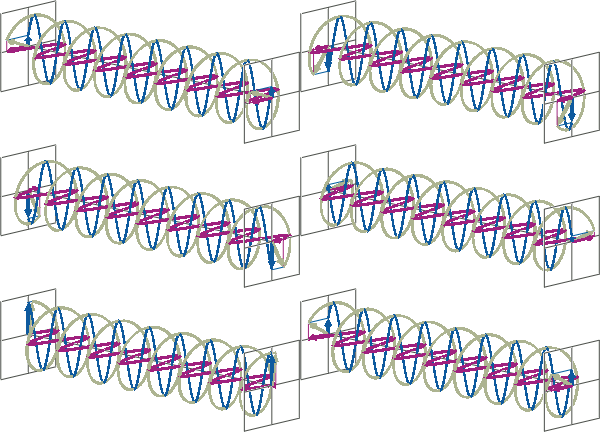

- An optical element that converts between linearly polarised light and circularly polarised light is termed a quarter-wave plate. A quarter-wave plate is birefringent, i.e., the refractive indices seen by horizontally and vertically polarised light are different. A suitably oriented plate will convert linearly polarised light into circularly polarised light by slowing one of the linear components of the beam with respect to the other so that they are exactly one quarter-wave out of phase. This will produce a beam of either left- or right-CP light.
For more details about how CD spectrometers generate circularly polarised light using a photoelastic modulator (PEM), check out our CD Instrumentation FAQs.
- Circular dichroism (CD), measured as a function of wavelength, is the difference in absorbance of left-handed circularly polarised (L-CP) light and right-handed circularly polarised (R-CP) light. This difference can be detected when a chiral molecule contains one or more light-absorbing groups—so-called chiral chromophores.
CD = ΔA(λ) = A(λ)L-CP - A(λ)R-CP, where λ is the wavelength
Why does CD data contain positive and negative values?
- When chiral chromophores are present, one state of circularly polarised light will be absorbed to a greater or lesser extent than the other. Over corresponding wavelengths, a circular dichroism signal can, therefore, be positive or negative, depending on whether L-CP light is absorbed to a greater extent than R-CP light (CD signal positive) or to a lesser extent (CD signal negative).
What are the chromophores and chiral centers in proteins?
- In the far-UV, the principle chromophore that dominates the spectral signal of proteins is the peptide carbonyl bond (C=O):
π → π* at ~ 190 nm; n → π* at ~ 210-230 nm
The chiral center is the α-carbon atom in the protein backbone.
- In the near-UV, aromatic amino acids (i.e., tryptophan, and to a lesser extent tyrosine and phenylalanine) are the predominant chromophore. Their interaction with circularly polarised light is strongly influenced by the chiral environment of nearby parts of the protein.
- Disulfide bonds, often found in proteins, may influence both far- and near-UV circular dichroism spectra.
How many moles per liter of protein do I need for measuring CD?
Why not try our interactive applet for exploring the concepts below?
- It depends. Firstly, the molar concentration depends on the molecular weight of the protein, so the molar concentration required to obtain a decent CD signal will strongly depend on the specific protein you want to measure. Therefore, it generally makes more sense to discuss sample requirements for CD spectroscopy in terms of a mass concentration, typically mg/mL.
- Secondly, what you really want to ask for is the total mass of protein you need rather than the concentration, because the target concentration required to get a suitable protein CD signal will be different for different optical path lengths. CD spectroscopy is an absorbance-based technique and therefore, the Beer-Lambert law applies:
A = εcl
where ε is the extinction coefficient of the molecule of interest in M-1 cm-1, c is the concentration in M, and l is the optical path length in cm. Therefore, the shorter the optical path length, the larger the required concentration to get the same absorbance (and, in turn, the same magnitude of a CD signal).
- Thirdly, the amount of protein required depends on which wavelength range you are interested in. For far-UV CD measurements, which inform about protein secondary structure, you generally need at least an order of magnitude (typically about 20 times) less protein than for near-UV CD measurements, which inform about protein tertiary structure.
- The far-UV CD signal comes from the protein peptide bonds, and the number of these chromophores in your sample directly corresponds to how much protein (in mg) you have in your sample (assuming the same average molecular weight for all amino acids, typically 110 Da). Therefore, the required amount of protein for obtaining a good far-UV CD signal is virtually independent of the size or nature of the protein.
For far-UV CD measurements, about 0.03 mg to 0.04 mg are typically required to obtain an optimal signal. If you use, for example, a cuvette with an optical path length of 0.5 mm, the required volume is about 100 μL, so the required concentration will be 0.3 mg/mL to 0.4 mg/mL. For a cuvette with an optical pathlength of 10 mm, you will need a concentration 20 times lower, i.e., about 0.015 mg/mL to 0.02 mg/mL. However, you will also need a volume that is about 20 times larger, therefore the total amount of protein needed is about the same - the lower concentration required does not mean that you save protein! - For near-UV CD measurement, estimating the required protein amount is less straightforward. This is because the near-UV signal arises from aromatic amino acids (mainly tryptophan and tyrosine) and disulfide bonds, and the number of these chromophores per protein molecule can differ dramatically between different proteins. Therefore, there is no general relationship between the expected signal and the protein mass as for the far-UV.
However, the extinction coefficient of a protein in water that can be expected at 280 nm can be estimated using an empirical equation reported in Pace et al. 1995, Protein Sci. 4:2411-2423. By combining the reported equation with the Beer-Lambert law, assuming a target absorbance of 1 AU at 280 nm, and under the assumption that all cysteine residues form disulfide bonds, we obtain the following, simplified equation for estimating the required protein concentration in mg/mL:
c = M / l / (nW x 5500 + nY x 1490 + nC x 62.5)
c: estimated protein concentration (mg/mL)
M: protein molar mass (Da)
nW, nY, nC: numbers of Trp, Tyr, Cys per molecule
l: optical pathlength (cm)
What is the lowest wavelength at which CD data can be obtained?
- With Synchrotron Radiation CD (SRCD) spectroscopy, data to as low as ~130 nm can be obtained.
- For bench top CD instruments, data down to ~170 nm can be obtained, but only if using unconventional experimental conditions.
- For routine measurements, a lower limit of 180 nm is usually reasonable.
- Certain buffers and excipients in the sample will increase the lower wavelength cut-off, often to >200 nm.
See our in-depth answer to this question!
What are potential causes of spectral artefacts that can be encountered when doing CD spectroscopy?
- Insufficient nitrogen purging
- Exceeding sample concentration
- Compromised sample integrity
- Buffer absorbance and/or chiral buffer compounds
- Differential Light Scattering
- Differential Absorbance Flattening. For more information on this phenomenon, click here.
Related:
CD Instrumentation FAQs


