Using High Throughput DSF to Obtain Binding Parameters
Introduction
Binding analysis studies are a crucial area of drug development. The characterisation of interaction and the KD (Dissociation constant) parameter are critical in selecting suitable candidates for development. Poor data quality, false positive or negatives, or non-specific binding can lead to increased costs. Therefore, orthogonal approaches are needed to confirm and screen thousands of small molecule compounds within the libraries.
Interaction analysis by the SUPR-DSF offers high-speed and label-free measurements across the analyte binding concentration range. The measurements are free in solution and are not influenced by surface effects, mass transport or refractive index buffer issues. The measurements confirm binding is specific by detecting induced stability changes in the protein-ligand complex. This is depicted from the shift in the emitted fluorescence as it melts, measured as a function of ligand concentration, from which the KD can be calculated. This method uses commercially available, low cost, low volume 384-well microplates, and is capable of screening thousands of samples for stability in a day to confirm binding. Binding induced stability changes are readily apparent even for very weak binding partners (e.g., fragment libraries), confirming the binding is specific and of structural/functional importance. The SUPR-DSF can be integrated into existing robotic solutions, making very large-scale screens easy and rapid to complete. The below investigation applies the SUPR-DSF platform to the study of binding effects of a ligand with carbonic anhydrase.
Results
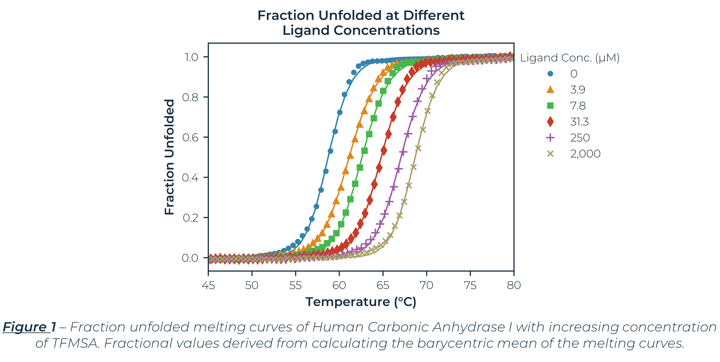
The fraction unfolded melting curves for Carbonic Anhydrase I (hCA-I) from Human Erythrocytes with Trifluoromethanesulfonimide (TFMSA) are shown in Figure 1. The curves represent the average of the triplicate values. The largest standard error (0.07oC) is smaller than the symbol size. The control (No Ligand) had a Tm of 58.7°C, which agreed with reported values.[1] Examining Figure 1, you can clearly see TFMSA stabilizes hCA-I by shifting the melting curves to the right at higher concentrations. The saturating dose of 2 mM shifted the Tm by 10.0°C to 68.7°C. The results for all the samples, including Tonset, Tm, and van 't Hoff enthalpies (ΔHm) are shown in Table 1.
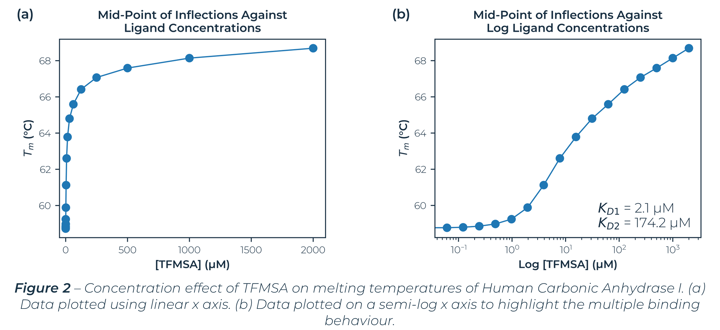
Figure 2 illustrates the melting temperatures of hCA-I as a function of TFMSA concentration. Fitting the measured melting temperatures to standard equations[2] with a 95% confidence interval (CI)[3] found multiple binding sites. An initial binding site dissociation constant of 2.1 µM (CI: 0.82 µM – 3.85 µM) which is comparable with literature values[4] and a second binding site dissociation constant at 174.2 µM (CI: 82.8 µM – 424.5 µM).
Conclusion
The use of the SUPR-DSF to study binding interactions has demonstrated that this technique offers a viable and unique solution. The SUPR-DSF offers an intrinsic fluorescence-based high‑throughput methodology that is free in solution, with all measurements carried out directly in the 384-well plate-based format. The SUPR-DSF rapidly provided highly precise data with excellent sensitivity in the study of Carbonic Anhydrase with TFMSA. The values obtained agree with previously published literature values for KD and prove that the SUPR-DSF can be used as either a pre-screening or confirmational tool for ligand binding studies.
Methodology
Several isoforms of carbonic anhydrase were mixed with increasing amounts of trifluoromethanesulfonimide to generate 16-point binding curves. The data shown specifically used Carbonic Anhydrase I from Human Erythrocytes. Stock solutions of TFMSA and carbonic anhydrase were prepared in PBS (2% DSMO, pH 7.4), and were automatically dispensed into a 384‑well microplate in triplicate. The final protein concentration was 0.2 mg⁄mL with a total well volume of 20 µL. After dispensing, the microplate was incubated for 20 minutes and sealed with a commercially available film to prevent evaporation. The plate was thermally ramped from 20°C ‑ 100°C at a ramp rate of 1°C per minute. The melting temperatures were calculated[5] and the KD was calculated with standard equations from the melting temperatures[]. All results and methods are available on request.

References
[ 1] – D. Matulis, J. Kranz, F. Salemme, M. Todd. “Thermodynamic Stability of Carbonic Anhydrase: Measurements of Binding Affinity and Stoichiometry Using ThermoFluor”. Biochemistry, Vol. 44, 5258‑5266. 2005.
[2] – M. Vivoli, H. R. Novak, J. A. Littlechild, N. J. Harmer. “Determination of Protein-ligand Interactions Using Differential Scanning Fluorimetry”. J. Vis. Exp. Vol. 91, e51809. 2014.
[3] – G. C. Kemmer & S. Keller. “Nonlinear least-squares data fitting in Excel spreadsheets”. Nature protocols. Vol. 5, p. 267-81. 2010.
[4] – N. Bai, H. Roder, A. Dickson, J. Karanicolas. “Isothermal Analysis of ThermoFluor Data can readily provide Quantitative Binding Affinities”. Scientific Reports, Vol. 9, p. 2650. 2019.
[5] – J. Walters, S. L. Milam, A. C. Clark. “Practical Approaches to Protein Folding and Assembly: Spectroscopic Strategies in Thermodynamics and Kinetics”. Methods in Enzymology. Vol. 445, p. 1‑39. 2009.